Question title
How to configure animations for VChart's combo chart?
Problem description
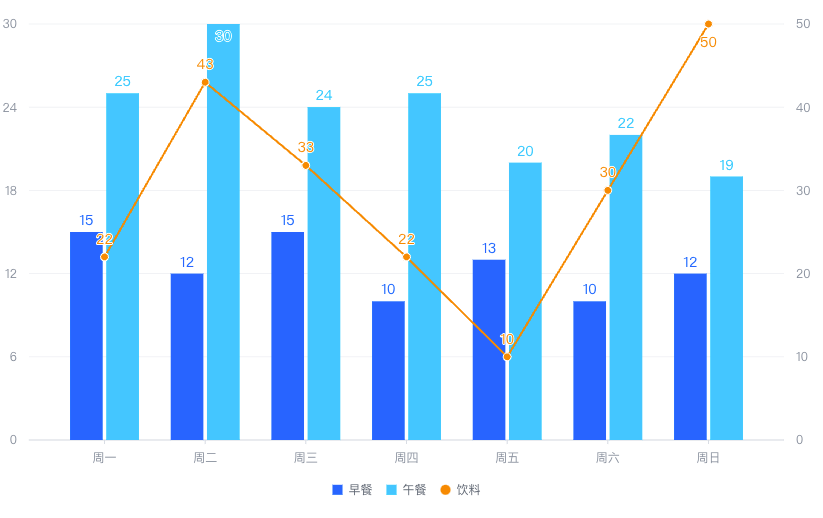
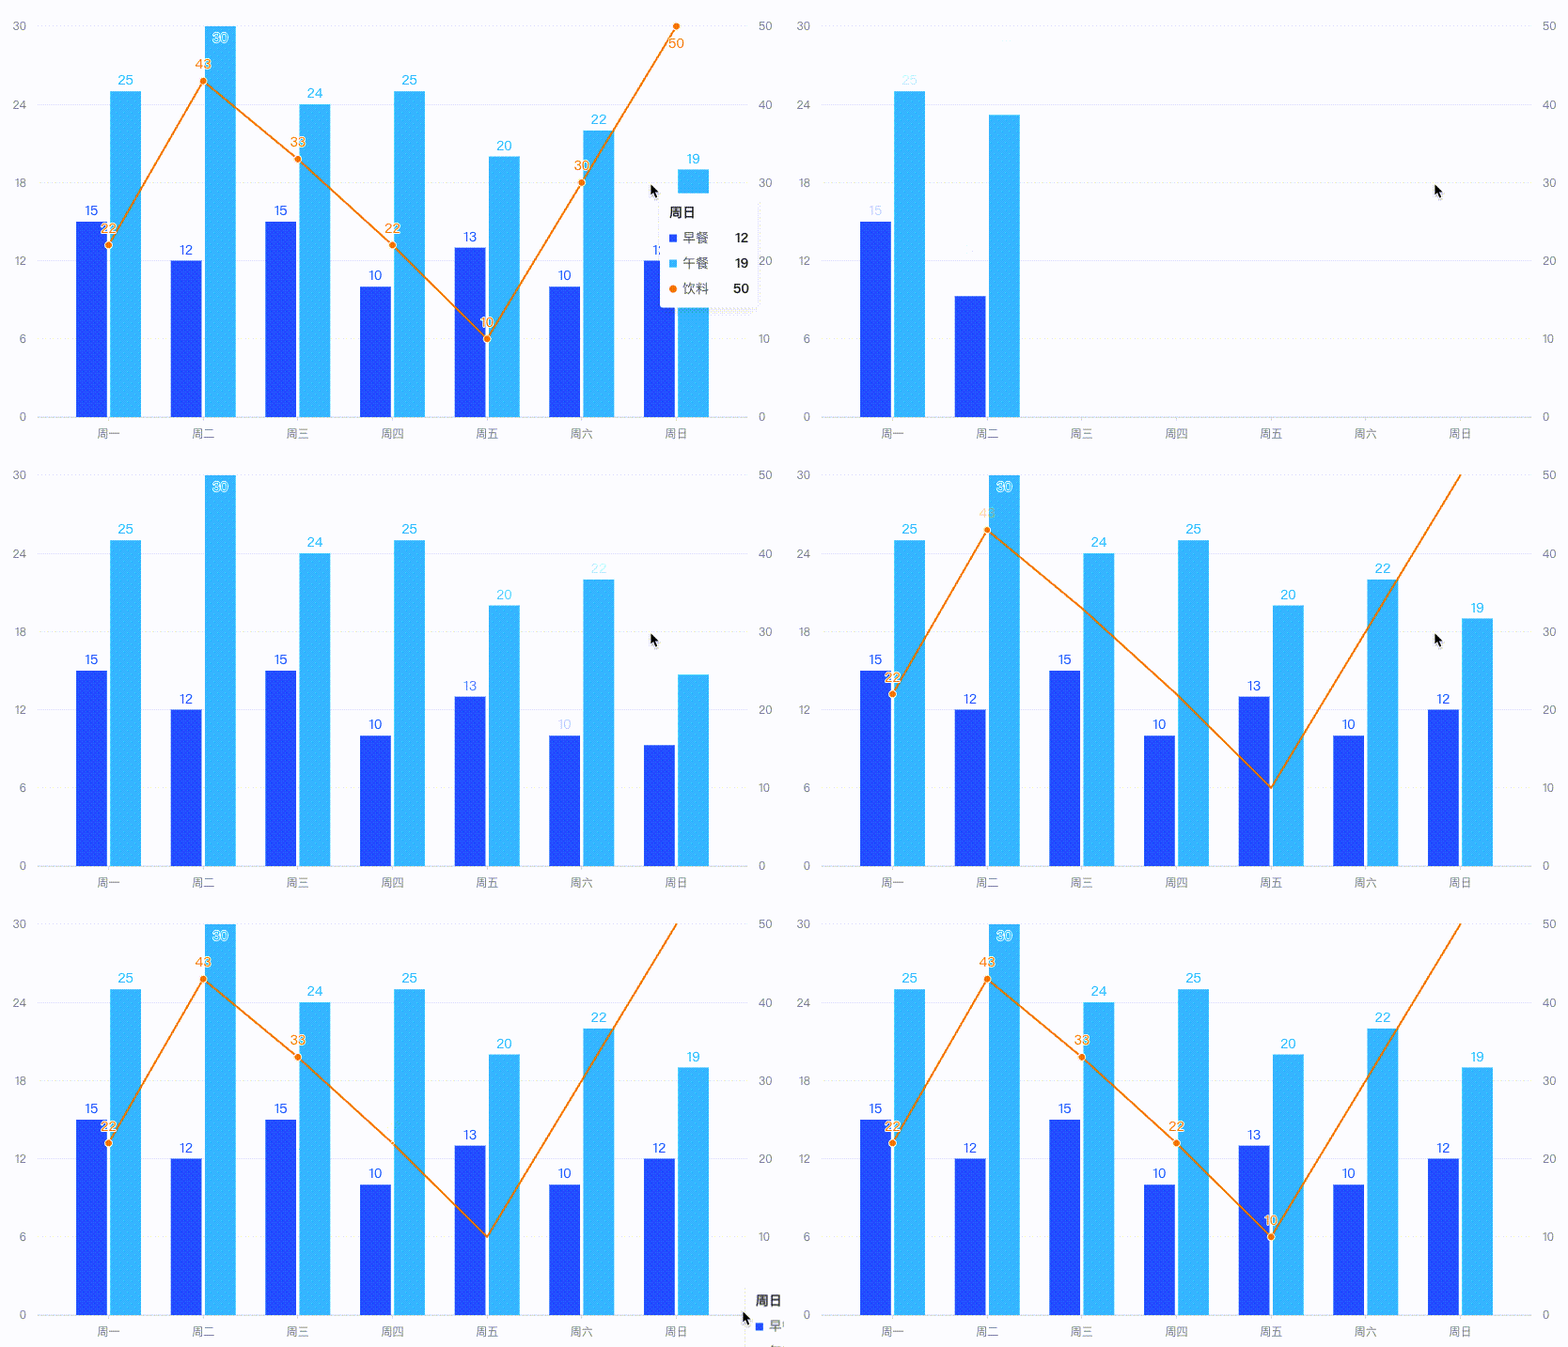
In a biaxial diagram, how to make the left and right axes execute the animation in order, and after the left axis column is executed, the right axis line will play the animation again?

Solution
Firstly, in VChart, its animation can be configured within each series. We can configure animations separately in columns and lines.
Then there is a dedicated configuration for outro animation in the series: animationAppear.
animationAppear?: {
  preset?: Preset | false;
  duration?: number;
  delay?: number;
  easing?: EasingType;
  oneByOne?: boolean;
};</br>
We can configure delay on the online animation to start playing outro animation after the column completes the animation.
series: [{
      type: 'bar',
      id: 'bar',
      animationAppear: {
        duration: 500
      }
    },
    {
      type: 'line',
      id: 'line',
      animationAppear: {
        delay: 500,
      }
    }
]</br>
In addition, if oneByOne is configured on the bar chart animation, it should be noted that the total animation duration of the bar chart = x-axis number * duration
Code example
const spec = {
  type: 'common',
  seriesField: 'color',
  data: [
    {
      id: 'id0',
      values: [
        { x: '周一', type: '早餐', y: 15 },
        { x: '周一', type: '午餐', y: 25 },
        { x: '周二', type: '早餐', y: 12 },
        { x: '周二', type: '午餐', y: 30 },
        { x: '周三', type: '早餐', y: 15 },
        { x: '周三', type: '午餐', y: 24 },
        { x: '周四', type: '早餐', y: 10 },
        { x: '周四', type: '午餐', y: 25 },
        { x: '周五', type: '早餐', y: 13 },
        { x: '周五', type: '午餐', y: 20 },
        { x: '周六', type: '早餐', y: 10 },
        { x: '周六', type: '午餐', y: 22 },
        { x: '周日', type: '早餐', y: 12 },
        { x: '周日', type: '午餐', y: 19 }
      ]
    },
    {
      id: 'id1',
      values: [
        { x: '周一', type: '饮料', y: 22 },
        { x: '周二', type: '饮料', y: 43 },
        { x: '周三', type: '饮料', y: 33 },
        { x: '周四', type: '饮料', y: 22 },
        { x: '周五', type: '饮料', y: 10 },
        { x: '周六', type: '饮料', y: 30 },
        { x: '周日', type: '饮料', y: 50 }
      ]
    }
  ],
  series: [
    {
      type: 'bar',
      id: 'bar',
      dataIndex: 0,
      label: { visible: true },
      seriesField: 'type',
      dataIndex: 0,
      xField: ['x', 'type'],
      yField: 'y',
      animationAppear: {
        duration: 500,
        oneByOne: true
      }
    },
    {
      type: 'line',
      id: 'line',
      dataIndex: 1,
      label: { visible: true },
      seriesField: 'type',
      xField: 'x',
      yField: 'y',
      stack: false,
      animationAppear: {
        delay: 500 * 7,
        duration: 500,
        oneByOne: true
      }
    }
  ],
  axes: [
    { orient: 'left', seriesIndex: [0] },
    { orient: 'right', seriesId: ['line'], grid: { visible: false } },
    { orient: 'bottom', label: { visible: true }, type: 'band' }
  ],
  legends: {
    visible: true,
    orient: 'bottom'
  }
};

const vchart = new VChart(spec, { dom: CONTAINER_ID });
vchart.renderSync();

// Just for the convenience of console debugging, DO NOT COPY!
window['vchart'] = vchart;</br>
Results show

